
How to Read Bitcoin Candlestick Charts: A Beginner’s Guide
How to Read Bitcoin Candlestick Charts: A Beginner’s Guide
Did you know? Over 60% of cryptocurrency traders lose money due to poor chart analysis. Mastering Bitcoin candlestick charts could be your game-changer in digital currency trading.
What Are Bitcoin Candlestick Charts?
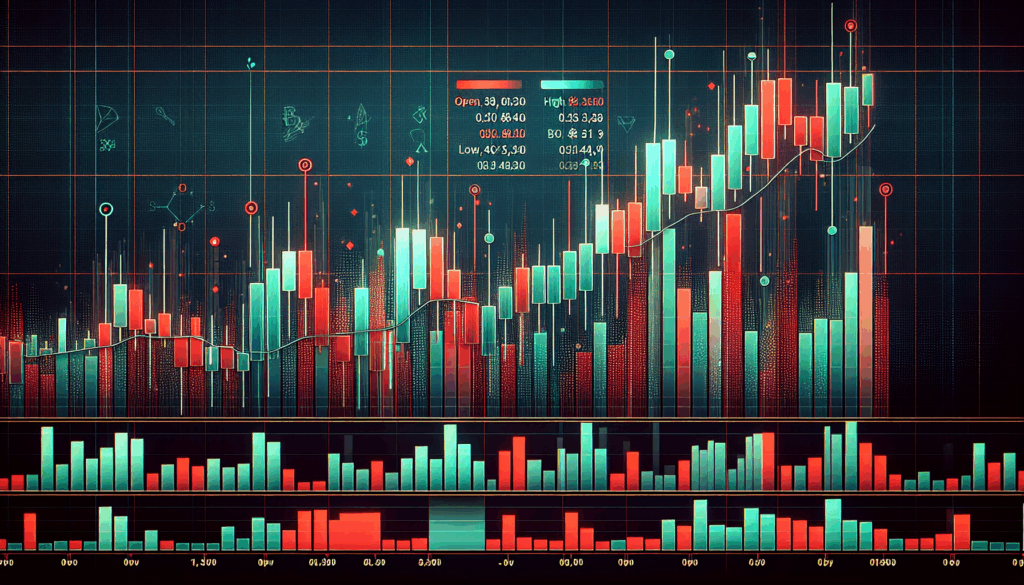
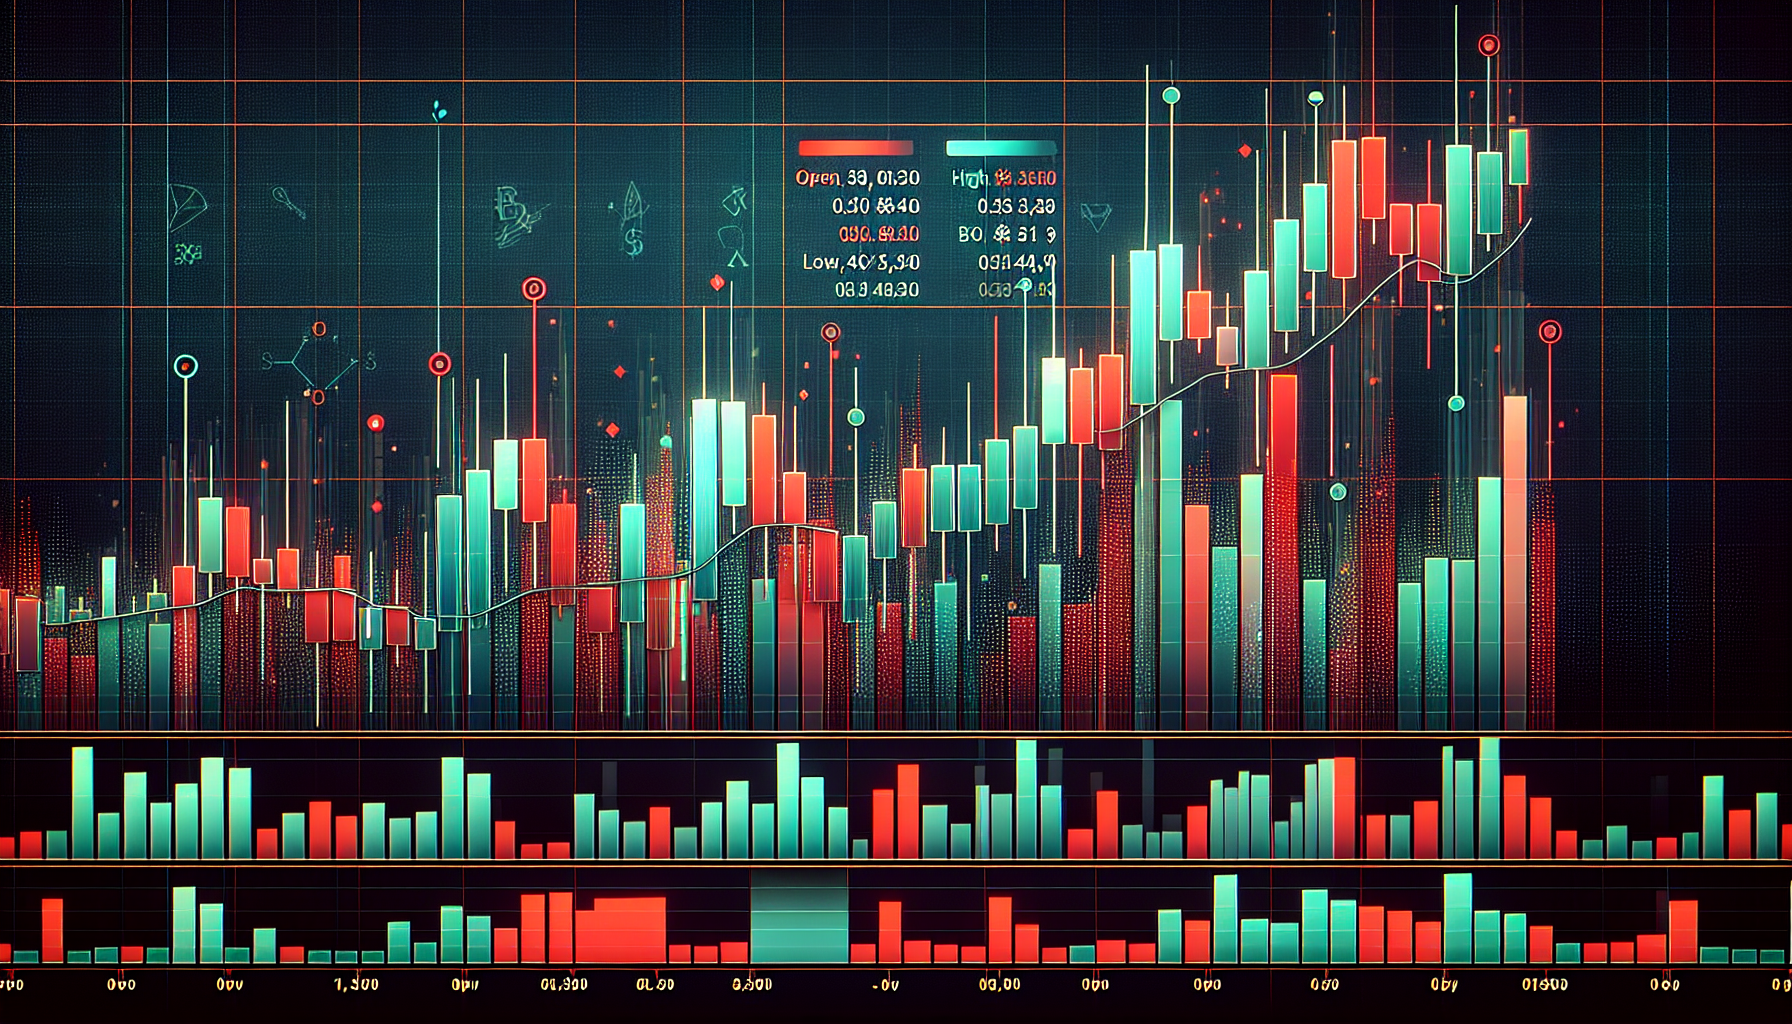
Imagine these charts as the “mood rings” of blockchain markets. Each candle tells a story about price movement during a specific time period (1 minute, 1 hour, 1 day, etc.).
The Anatomy of a Candle
- Green/White candle: Price increased (closed higher than opening)
- Red/Black candle: Price decreased
- Wick: Shows highest/lowest prices reached
- Body: Opening vs closing price difference
5 Essential Candlestick Patterns Every Trader Should Know
Spotting these patterns helps predict crypto market trends:
1. The Hammer (Bullish Reversal)
Looks like a hammer with long lower wick. Example: After a downtrend, signals potential price rise.
2. Shooting Star (Bearish Reversal)
Appears when uptrend may reverse downward. The long upper wick shows rejected higher prices.
3. Engulfing Pattern
When a large candle completely “eats” the previous one. Bullish if green engulfs red, bearish if reversed.
Common Mistakes Beginners Make
- Ignoring trading volume (high volume confirms pattern validity)
- Analyzing single candles instead of context
- Forgetting timeframes (daily vs hourly charts tell different stories)
Pro Tip: Combine With Other Indicators
For better accuracy in your digital asset investments:
- Moving averages (200-day MA is key)
- Relative Strength Index (RSI)
- Support/resistance levels
Remember: No single indicator guarantees success. According to 2025 Crypto Trader Survey, traders using 3+ indicators have 2.3x higher profitability.
Where to Practice Chart Reading
Free tools for cryptocurrency technical analysis:
- TradingView (web-based platform)
- CoinMarketCap charting tools
- Binance/Kraken exchange charts
Start small: Paper trade first to test your analysis without risking real funds.
Ready to level up your trading? Bookmark this guide and check our Bitcoin Trading Strategies article next.
Disclaimer: Cryptocurrency trading involves risk. This content is for educational purposes only.
For more expert insights, visit latestcryptotoday
About the author:
Dr. Elena Rodriguez
Published 18 papers on blockchain analysis
Lead auditor for the Ethereum 2.0 security assessment
